
SEMINARS AND WORKSHOPS
Workshop on “Data Cleaning and Dashboard Creation Using Power BI”
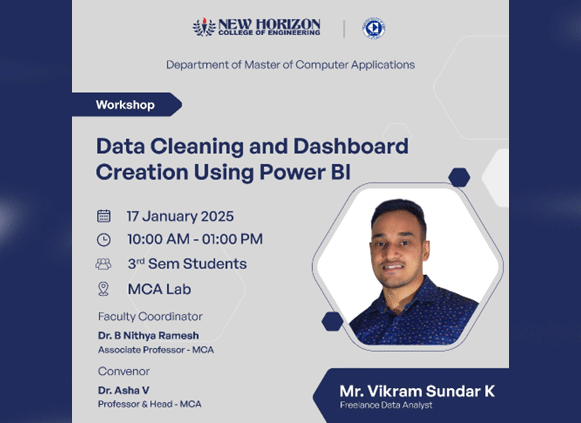
The workshop, Data Cleaning and Dashboard Creation Using Power BI, provided a hands-on learning experience for students to develop their data preparation, transformation, and visualization skills. It was organized for MCA students to learn the experiences of Power BI for data-driven decision-making.
Topics Emphasized:
- Understanding Power BI
The session began with an overview of Power BI, covering its core components such as Power Query, Data Modeling, and the Visualization pane. Participants were introduced to its intuitive interface and its broad range of business intelligence capabilities. - Data Cleaning Techniques
- Importing Data: The session demonstrated how to import data from multiple sources, including Excel, CSV files, and databases.
- Data Transformation: Attendees learned to use Power Query Editor to clean datasets, handle missing values, remove duplicates, and standardize formats.
- Advanced Cleaning: Techniques like unpivoting columns, merging datasets, and creating calculated columns were explored.
- Data Modeling
Participants gained insights into creating relationships between tables and utilizing the DAX (Data Analysis Expressions) language for calculated measures and columns. This step emphasized structuring data effectively to ensure seamless analysis. - Dashboard Creation
- Visualization Best Practices: The workshop stressed the importance of clarity and user-centric design in dashboards.
- Building Visuals: Attendees created interactive visuals such as bar charts, line graphs, slicers, and cards.
- Interactivity: The session covered adding filters, drill-throughs, and bookmarks to enhance the dashboard’s functionality.
Outcomes: By the end of the session, students were able to:
- Clean and transform raw data using Power BI’s Power Query Editor.
- Develop a well-structured data model with relationships and calculated fields.
- Create dynamic and visually appealing dashboards tailored to specific business needs.
ACTIVITIES CONDUCTED:
- Case Study and Practical Application: A case study was presented where students applied the acquired techniques to transform raw data into an insightful dashboard, showcasing trends, KPIs, and actionable insights.
- Q&A and Discussion: The session addressed participant queries and explored additional features of Power BI, providing valuable insights into its advanced functionalities. Additionally, it focused on sharing best practices for dashboard design and data storytelling, ensuring that participants could create impactful and visually compelling dashboards to communicate insights effectively.