SEMINARS AND WORKSHOPS
FDP on Visual Data Analysis Using Tableau
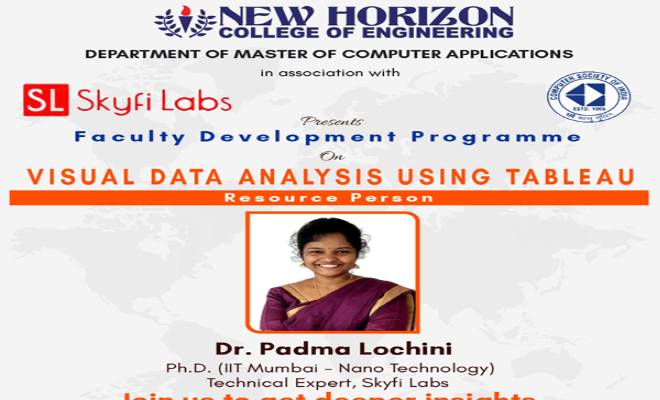

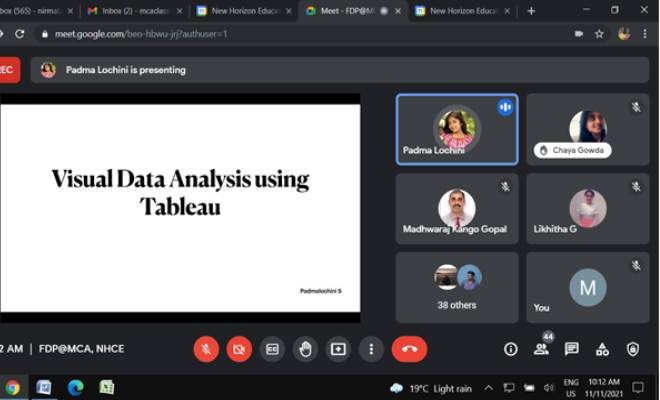
| Date | 11th November 2021 |
| Timing | 10:00 a.m. to 1:00 p.m. |
| Mode | ONLINE through Google Meet Google Meet details: https://meet.google.com/beo-hbwu-jrj |
| Session Date & Timings: | November 2021; Morning 10:00 am to 1:00 pm |
| Faculty Programme Co-ordinators | Dr. A.P. Nirmala, Associate Professor
Dr. Arpana Prasad, Associate Professor |
| Convenor | Dr. V. Asha, Prof. & HOD MCA |
| Number of participants certified on completion of the FDP | 52 |
Profile of the Expert:
Er. Padmini Lochini is working on a research project in Computational Biology in NantoTechnology department at IIT Mumbai. She is working for Skyfi Labs, an education company founded by IIT Kanpur alumni – Pavan Ponnaganti and Aditya Chundi. After graduation they spent some time in industry and they realized the challenges students in core engineering are facing and started Skyfi Labs to develop products that will help these students. With such a background, Skyfi Labs started as a small start-up in Bangalore and developed a way to train students in core engineering using a combination of great trainers + great technology. Today, we are training students from more than 35 countries. Due to our innovative methodology and great quality, we won several awards for our work and have partnered with prestigious organizations like Boeing, Altair, Mauritius Research Council and IIT Delhi. Our founder has also been a part of AICTE team which drafted a concept paper on UG curriculum.
Objective:
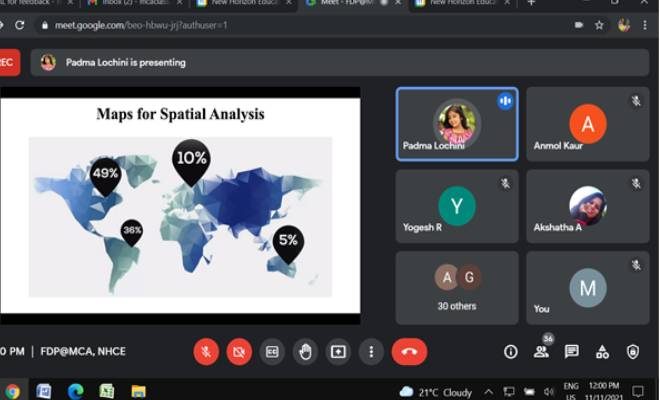
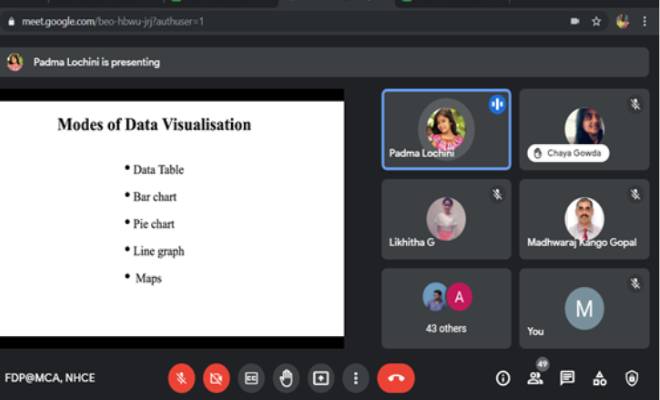
Data visualization is the graphical representation of information and data. By using visual elements like charts, graphs, and maps, data visualization tools provide an accessible way to see and understand trends, outliers, and patterns in data.
In the world of Big Data, data visualization tools and technologies are essential to analyze massive amounts of information and make data-driven decisions.
Content:
Data visualization helps business stakeholders analyze reports regarding sales, marketing strategies, and product interest. Based on the analysis, they can focus on the areas that require attention to increase profits, which in turn makes the business more productive.
Data visualization turns raw data into a universally, consumable form. By providing access to valuable information, you give people the tools to develop more informed opinions and empower them to contribute their perspective in the decision–making process.
Tableau enables businesses to make decisions using the data visualization features available to business users of any background and industry. … Tableau provides immediate insight by transforming data into visually engaging, interactive views in dashboards.
Tableau is a powerful data visulization tool that is used to simplify raw data into easily understandable formats. … Data blending, real-time analysis, and collaboration of data are a few other features of Tableau.
