
CO-CURRICULAR ACTIVITIES
FDP on Data visualization using Google data studio
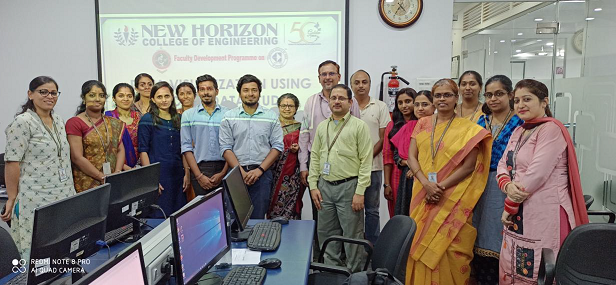
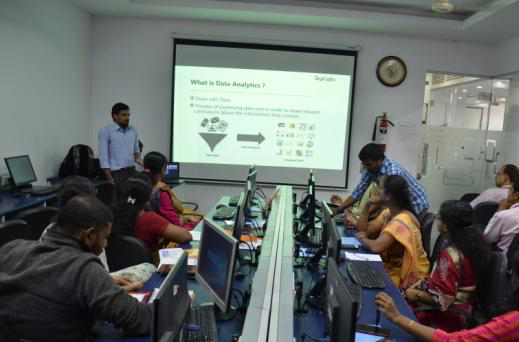
Data visualization is a concept of gathering data, performing analysis and representing them as a visual context, as said “A picture is worth a thousand words” in the form of a map or a graph. Data visualizations done effectively will allow the human brain to understand the properties of data in a subtle form and therefore come to conclusions at a faster time period rather than spending more time on that. Data Visualization also eases humans to detect patterns, trends, and outliers in the data used for analysis. Google Data Studio is a dashboard and reporting tool that is easy to use, customize, and share the patterns in the existing data. It’s a great tool to track KPIs that support business objectives and generate periodic reports.
Profile of the Guest:
- Mr. Koustubh Prem is currently working as Engineer at Skyfi Labs, an education company founded by IIT Kanpur alumni – Pavan Ponnaganti and Aditya Chundi. After graduation they spent some time in industry and they realized the challenges students in core engineering are facing and started Skyfi Labs to develop products that will help these students. With such a background, Skyfi Labs started as a small start-up in Bangalore and developed a way to train students in core engineering using a combination of great trainers + great technology. Today, we are training students from more than 35 countries. Due to our innovative methodology and great quality, we won several awards for our work and have partnered with prestigious organizations like Boeing, Altair, Mauritius Research Council and IIT Delhi. Our founder has also been a part of AICTE team which drafted a concept paper on UG curriculum.
- Mr. Vasanth is currently working as the Product Marketing Manager at Skyfi Labs, an education company founded by IIT Kanpur alumni – Pavan Ponnaganti. After graduation our founder spent some time in industry and realized the challenges students in core engineering are facing and started Skyfi Labs to develop products that will help these students. With such a background, Skyfi Labs started as a small start-up in Bangalore and developed a way to train students in core engineering using a combination of great trainers + great technology. Today, we are training students from more than 35+ countries. Due to our innovative methodology and great quality, we won several awards for our work and have partnered with prestigious organizations like Boeing, Altair, Mauritius Research Council and IIT Delhi. Our founder has also been a part of AICTE team which drafted a concept paper on UG curriculum.
Objective:
This FDP provides skills to represent the data in a graphical or pictorial format in an attempt to help people understand its significance. In today’s world, data visualization skills have become necessary to be able to identify or uncover patterns, correlations and trends etc…
FDP objectives are:
1. Discovering patterns in the data by using appropriate tools and techniques.
2. Understanding the behaviour of patterns and their significance in interpreting them in a more effective and efficient manner
Content:
Data Studio is like Google Analytics dashboards on steroids. With Google Analytics dashboards, we are limited to 12 widgets per dashboard and can only connect to the data in the particular view the dashboard is in. One of the major challenges with reporting is connecting to data. Data Studio already has built-in connections to several data sources (listed below) eliminating the need to schedule periodic data refreshes for your reports. All features were discussed by both the resource person.
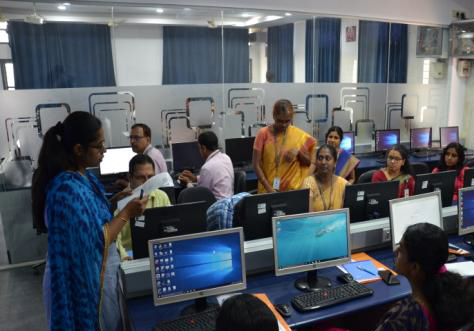
Outcome:
The session was an eye-opener for the faculty members to understand various buzz-words in Google data studio for visualization. Thanks for the Department and College management to organize such a useful FDP for the faculty members for MCA to do their endeavour in IT field successfully.